offdataai
offdataai Learn

Learn data modeling by building it.

A guided path through relational modeling, Kimball, Data Vault 2.0, semantic layers and ontologies, ending in a capstone project. Build every exercise in the Model Builder, get instant checks, and earn a certificate for each module.

Start learning for $1/month

Included in Explorer · $1/month · cancel anytime

tracks
8
tracks
hands-on lessons
47
hands-on lessons
of practice
~12 h
of practice
1

Learn in short steps

Each lesson is a few focused steps with tables, SQL and the mistakes people actually make, plus quick checks that explain every answer.

2

Build it yourself

Model it on the real offdataai Model Builder canvas, define metrics on a star schema, or connect ontology concepts. No sandbox toy.

3

Watch the checks go green

Every rule is checked live as you build, with a hint when you need one. Finish, then compare your work with the reference answer.

A guided path

One lesson at a time, in the right order.

Lessons unlock as you pass them, and each module opens once the one before it is complete. You learn the vocabulary first, then build source models, analytics models, a semantic layer and an ontology, and finish with a capstone that ties them together.

  1. 1Foundations: concepts, terms and best practicesBeginner · 6 lessons
  2. 2Relational modeling (3NF)Beginner · 4 lessons
  3. 3Dimensional modeling (Kimball)Beginner · 8 lessons
  4. 4Data Vault 2.0Intermediate · 5 lessons
  5. 5Build a semantic layerIntermediate · 5 lessons
  6. 6Build an ontologyIntermediate · 5 lessons
  7. 7Context layer for AI agentsAdvanced · 5 lessons
  8. 8Project: Brewly, end to endCapstone project · 9 lessons
Inside a lesson

Read it, build it, get it checked.

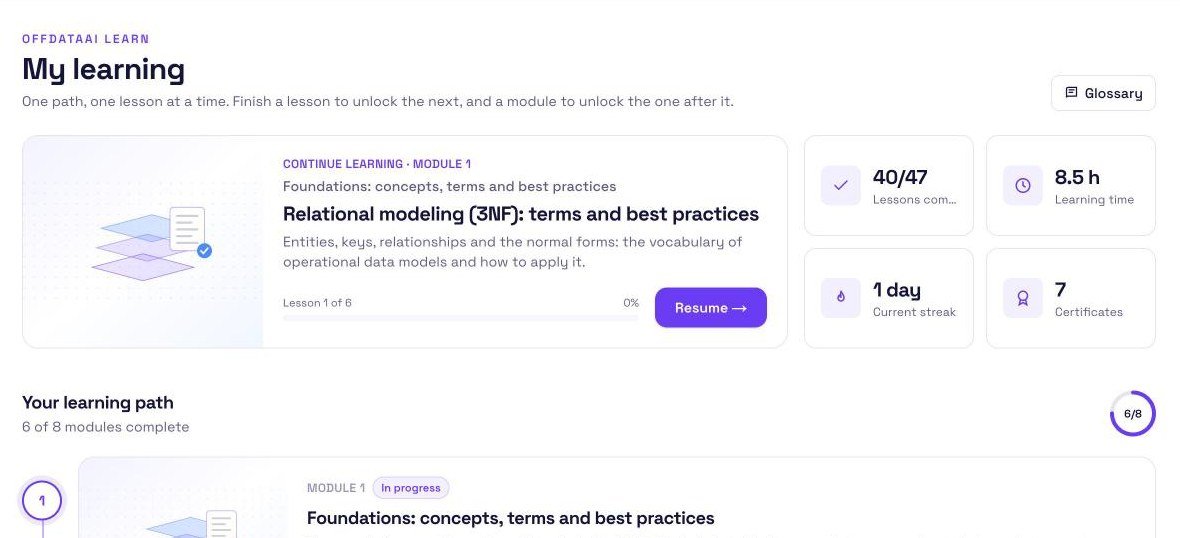
The My learning dashboard with a continue card, stats and the learning path
Your learning path: pick up where you left off.
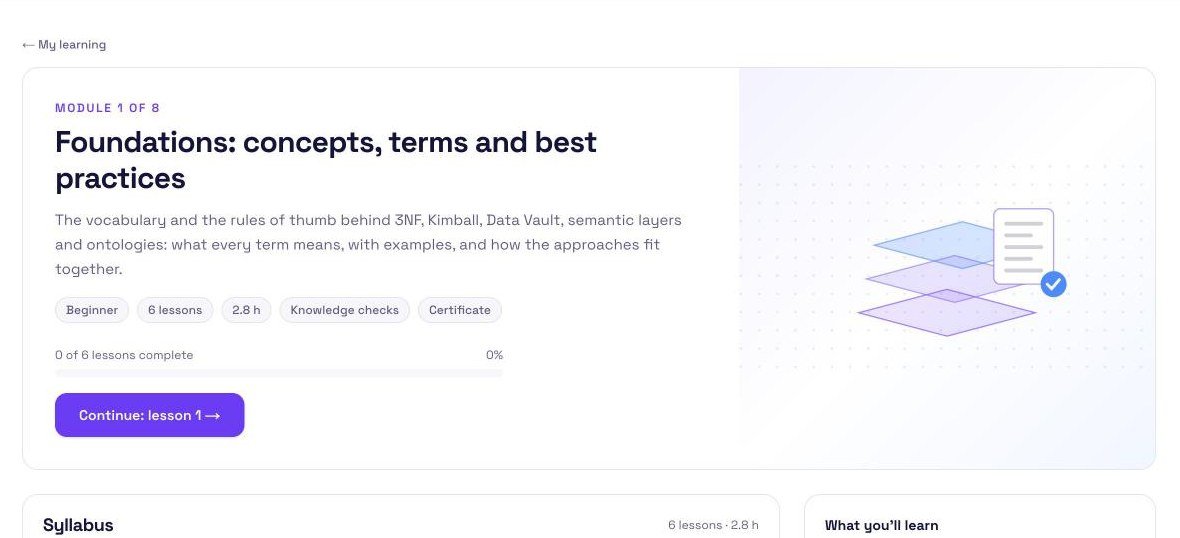
A module page with its syllabus, outcome and certificate
Every module has a syllabus, an outcome and a certificate.
The lesson player with the module syllabus beside a lesson
Short steps with quick checks, lesson by lesson.
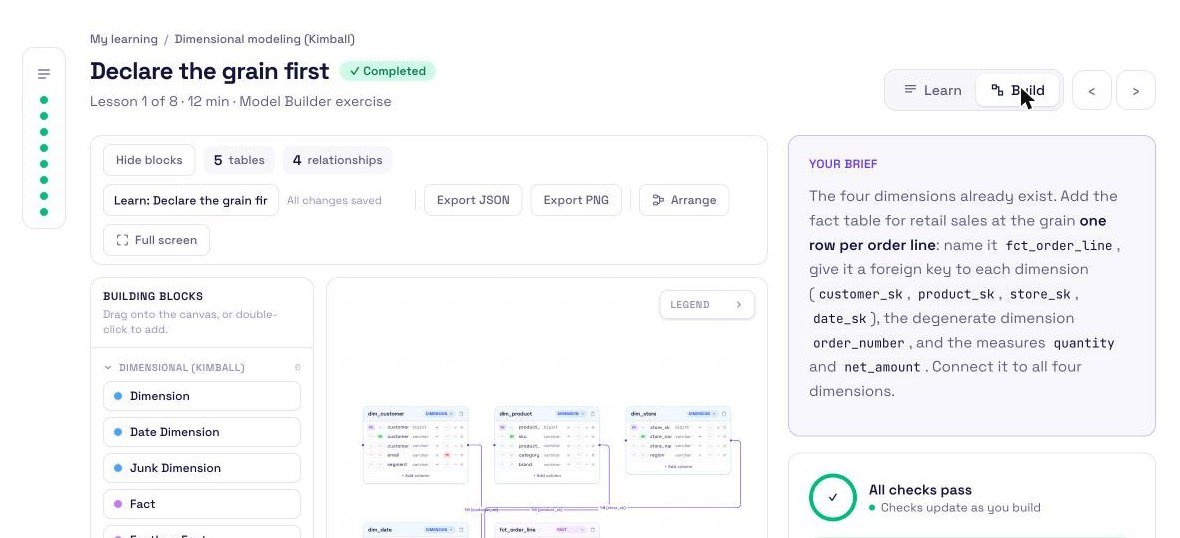
A modeling exercise on the Model Builder canvas next to the brief
Build the answer on the real Model Builder canvas.
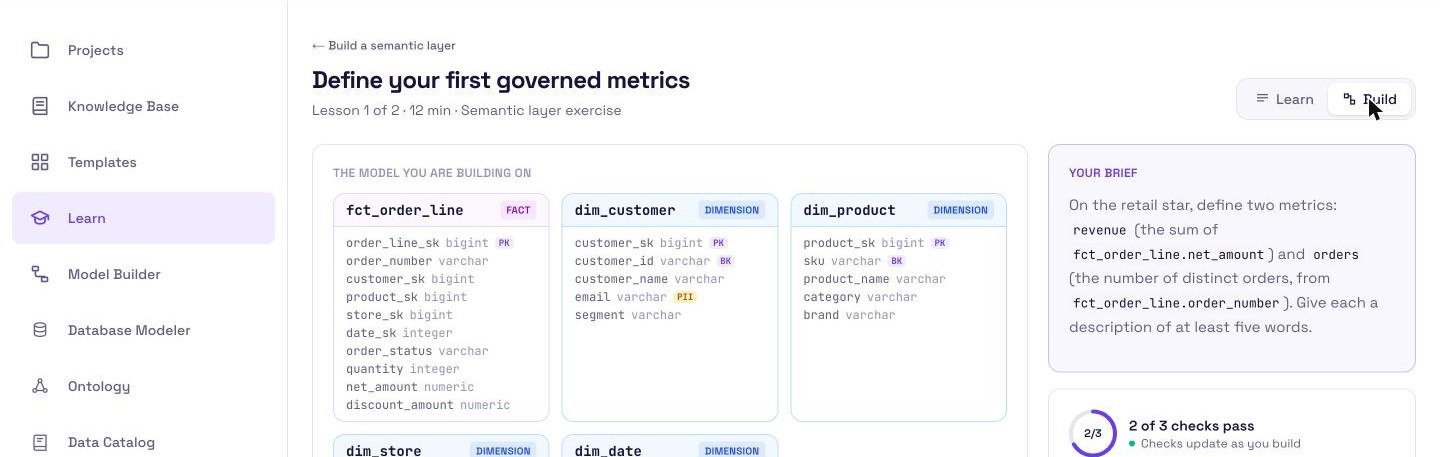
A semantic layer exercise on a retail star schema with live checks
Define governed metrics, checked live as you build.
The searchable glossary of data modeling terms
229 terms, each with an example and related terms.
Course catalog

From your first fact table to an ontology AI agents can use.

Projects: build it end to end

One business, start to finish. Concepts, source model, star schema, metrics, ontology and guardrails, each step building on the last.

End-to-end projectIntermediate9 lessons · about 120 minutes

Project: Brewly, end to end

Brewly roasts specialty coffee and sells it two ways: subscriptions (a bag every week or every month, on one of three plans) and one-off orders from its web shop. It has 40,000 customers and a small team that keeps asking questions nobody can answer quickly:

Every step continues your own work from the last: concepts, source model, star schema, history, snapshot, metrics, ontology and guardrails.

Outcome: You can carry a real business case from requirements to a governed, agent-ready data model and explain every decision.

  1. 1

    Meet Brewly: name the business concepts

    Before any table design, agree what the business is made of.

    Build concepts and relationships · 12 min · instant checks

  2. 2

    Model Brewly's source system

    Fix the order table that can only hold one coffee, and connect every table.

    Build it in the Model Builder · 14 min · instant checks

  3. 3

    Design Brewly's star schema

    Build the order-line fact and its dimensions on top of your source model.

    Build it in the Model Builder · 16 min · instant checks

  4. 4

    Add history and a second date

    Keep revenue by city true when customers move, and measure shipping time.

    Build it in the Model Builder · 12 min · instant checks

  5. 5

    Model subscriptions as a monthly snapshot

    MRR and churn aren't events. Capture the state of every subscription each month.

    Build it in the Model Builder · 14 min · instant checks

  6. 6

    Define Brewly's semantic layer

    Turn your star into the governed metrics every dashboard and agent will share.

    Define governed metrics · 14 min · instant checks

  7. 7

    Map Brewly's ontology onto your model

    Your step 1 concepts come back. Now they point at the analytics model.

    Build concepts and relationships · 12 min · instant checks

  8. 8

    Make Brewly's model safe for AI agents

    Move personal data where the assistant can't reach it, without losing anything.

    Build it in the Model Builder · 12 min · instant checks

  9. 9

    Ship it: answer Brewly's questions

    Put your model, metrics and ontology together and answer the team's real questions.

    Knowledge check · 12 min · instant checks

Courses: learn each skill

Beginner6 lessons · about 170 minutes

Foundations: concepts, terms and best practices

The vocabulary and the rules of thumb behind 3NF, Kimball, Data Vault, semantic layers and ontologies: what every term means, with examples, and how the approaches fit together.

Outcome: You can explain every core term in data modeling, semantics and ontology, and apply the best practices that go with them.

  1. 1

    Relational modeling (3NF): terms and best practices

    Entities, keys, relationships and the normal forms: the vocabulary of operational data models and how to apply it.

    Knowledge check · 25 min · instant checks

  2. 2

    Dimensional modeling (Kimball): terms and best practices

    Facts, dimensions, grain and slowly changing dimensions: the vocabulary of analytical models and how to apply it.

    Knowledge check · 25 min · instant checks

  3. 3

    Data Vault 2.0: terms and best practices

    Hubs, links and satellites, the specialized satellites and links, the business vault and how a vault is loaded: every Data Vault 2.0 term with an example, plus the rules that keep a vault auditable and easy to extend.

    Knowledge check · 30 min · instant checks

  4. 4

    Semantic modeling: terms and best practices

    Entities, measures, metrics and dimensions; metric types; additivity and the fan-out and chasm traps; time spines; governance; and how a semantic layer serves BI tools and AI assistants.

    Knowledge check · 30 min · instant checks

  5. 5

    Ontology: terms and best practices

    Concepts, instances, properties and relationships; taxonomies, is-a and part-of; definitions, labels and synonyms; RDF, OWL and SKOS in practice; mapping to tables; and how ontologies ground AI agents.

    Knowledge check · 30 min · instant checks

  6. 6

    How it fits together: one architecture from source to AI agent

    The capstone of Foundations: how 3NF sources, staging, Data Vault, Kimball marts, a semantic layer and an ontology-backed context layer form one stack, with the terms for moving, defining and governing data, and one question traced from source tables to an agent's answer.

    Knowledge check · 30 min · instant checks

Beginner4 lessons · about 50 minutes

Relational modeling (3NF)

Design operational schemas that store every fact once: normal forms, keys, lookups and constraints.

Outcome: You can normalize a messy table into a clean relational model and explain each step.

  1. 1

    Normalize an order system to 3NF

    Remove repeating groups and dependencies until every fact is stored exactly once.

    Build it in the Model Builder · 15 min · instant checks

  2. 2

    Lookup tables, keys and constraints

    Replace free-text codes with lookups and decide which key identifies each row.

    Build it in the Model Builder · 10 min · instant checks

  3. 3

    Supertypes and subtypes

    Model things that share a core but differ in detail, without a wide table full of NULLs.

    Build it in the Model Builder · 12 min · instant checks

  4. 4

    Associative entities and referential integrity

    Resolve a many-to-many into an entity of its own, and let foreign keys keep it honest.

    Build it in the Model Builder · 12 min · instant checks

Beginner8 lessons · about 110 minutes

Dimensional modeling (Kimball)

Design star schemas the way analytics teams use them: grain, facts, dimensions, history and conformance.

Outcome: You can design a star schema for a business process and defend every choice in review.

  1. 1

    Declare the grain first

    Every fact table starts with one sentence: what does a single row mean?

    Build it in the Model Builder · 12 min · instant checks

  2. 2

    Split a flat table into facts and dimensions

    Turn a wide export into a star schema: measures in the fact, descriptions in dimensions.

    Build it in the Model Builder · 15 min · instant checks

  3. 3

    Keep history with a Type 2 dimension

    When a customer moves segment, should last year's sales move with them?

    Build it in the Model Builder · 12 min · instant checks

  4. 4

    Build a date dimension and role-play it

    Replace raw dates with a calendar everyone shares, then use it twice on one fact.

    Build it in the Model Builder · 12 min · instant checks

  5. 5

    Conform dimensions across facts

    Two fact tables, one product dimension: the trick that makes cross-process reporting work.

    Build it in the Model Builder · 15 min · instant checks

  6. 6

    Factless facts and bridge tables

    Record events that have no measures, and attach many values of a dimension to one fact row without double counting.

    Build it in the Model Builder · 15 min · instant checks

  7. 7

    Periodic and accumulating snapshot facts

    Pick the right fact type for balances over time and for processes that move through milestones.

    Build it in the Model Builder · 15 min · instant checks

  8. 8

    Junk and degenerate dimensions

    Fold scattered low-cardinality flags into one junk dimension and keep transaction numbers on the fact.

    Build it in the Model Builder · 12 min · instant checks

Intermediate5 lessons · about 75 minutes

Data Vault 2.0

Model an integration layer that absorbs new sources and keeps full history: hubs, links and satellites.

Outcome: You can turn a set of source systems into hubs, links and satellites that survive change.

  1. 1

    Find the business keys and build hubs

    A hub is nothing but a business key, when it arrived and where it came from.

    Build it in the Model Builder · 12 min · instant checks

  2. 2

    Connect hubs with links, describe them with satellites

    Relationships go in links, attributes and their history in satellites.

    Build it in the Model Builder · 15 min · instant checks

  3. 3

    Integrate several sources into one hub

    Two systems that share a business key feed one hub, each with its own satellite.

    Build it in the Model Builder · 14 min · instant checks

  4. 4

    Make the vault queryable with PIT and bridge tables

    Point-in-time and bridge tables pre-compute the joins the raw vault makes expensive.

    Build it in the Model Builder · 16 min · instant checks

  5. 5

    From the vault to a star: build an information mart

    Dimensions and facts are views over hubs, links, satellites and PIT tables.

    Build it in the Model Builder · 16 min · instant checks

Intermediate5 lessons · about 60 minutes

Build a semantic layer

Turn a star schema into governed metrics that every dashboard and AI agent computes the same way.

Outcome: You can define simple, ratio and filtered metrics that stay correct at every level of aggregation.

  1. 1

    Define your first governed metrics

    Write revenue and order count once, so every dashboard and AI agent computes them the same way.

    Define governed metrics · 12 min · instant checks

  2. 2

    Ratio metrics and filters

    Average order value is revenue ÷ orders, not the average of a column. And cancelled orders don't count.

    Define governed metrics · 12 min · instant checks

  3. 3

    Semi-additive and non-additive measures

    Stock on hand adds up across warehouses but not across days. Tell the semantic layer which dimension it must never sum over.

    Define governed metrics · 12 min · instant checks

  4. 4

    Dimensions, hierarchies and time grains

    A metric can only be sliced by dimensions its fact table actually joins to. Declaring them is what stops a wrong answer before it is drawn.

    Define governed metrics · 12 min · instant checks

  5. 5

    Metric governance: one name, one meaning

    Trust comes from one definition per name, descriptions that say what is in and out, and a named owner who settles disputes.

    Define governed metrics · 10 min · instant checks

Intermediate5 lessons · about 50 minutes

Build an ontology

Describe what your data means: business concepts, definitions and relationships that people and AI agents can reason over.

Outcome: You can turn a data model into a concept graph with clear definitions and meaningful relationships.

  1. 1

    Name the concepts and define them

    An ontology starts with the things the business talks about, defined in one sentence each.

    Build concepts and relationships · 10 min · instant checks

  2. 2

    Connect concepts with verb phrases

    'Customer places Order' says something. 'Customer has Order' doesn't.

    Build concepts and relationships · 10 min · instant checks

  3. 3

    Classes and subclasses

    Retail customers and business customers are both Customers. A taxonomy says so, and says what makes each kind different.

    Build concepts and relationships · 10 min · instant checks

  4. 4

    Synonyms and a business glossary

    Sales says Client, support says Account holder, the warehouse says Item. Record those words on one concept instead of creating three.

    Build concepts and relationships · 10 min · instant checks

  5. 5

    Walk relationships to answer questions

    A question is a path through the concept graph. Find the path and you have the joins.

    Build concepts and relationships · 12 min · instant checks

Advanced5 lessons · about 60 minutes

Context layer for AI agents

Give AI agents the context to answer data questions correctly: definitions, metrics, join paths and access rules.

Outcome: You can design the context an agent needs to turn a business question into a correct, governed answer.

  1. 1

    What context an agent needs

    A schema tells an agent where data is stored. To answer correctly it also needs definitions, metrics, join paths, rules and freshness.

    Build concepts and relationships · 12 min · instant checks

  2. 2

    Descriptions agents can act on

    An agent picks a metric by reading its description. Say the grain, what is included and what is excluded.

    Define governed metrics · 12 min · instant checks

  3. 3

    Synonyms and disambiguation

    People say Customer, Client and Account for one thing, and Account for two different things. Write both down.

    Build concepts and relationships · 12 min · instant checks

  4. 4

    Governed join paths

    Relationships with specific verbs are the paths an agent walks to write joins. Declare them, and the agent stops inventing its own.

    Build concepts and relationships · 12 min · instant checks

  5. 5

    Guardrails: PII and what agents must not see

    Mark personal data, move it to a restricted table, and keep the tables agents query free of it.

    Build it in the Model Builder · 14 min · instant checks

Certificates

Show what you can build, not just what you watched.

  • A certificate for every module and one for completing the whole path.
  • Earned by passing hands-on exercises, checked against fixed design rules: grain, keys, history, governed metrics, concept definitions.
  • Verifiable: each certificate has its own public page and credential ID.
  • One click to LinkedIn: add it to Licenses & certifications, or share it as a post with the certificate as the preview.
A sample offdataai Learn certificate of completion
Sample certificate
Glossary

229 data modeling terms, explained with examples.

Every term from the Foundations module in one searchable glossary: what it means, a concrete example, the other names it goes by and the terms around it, with a link back to the lesson that teaches it.

Relational modeling (3NF)Dimensional modeling (Kimball)Data Vault 2.0Semantic modelingOntologyArchitecture
Included in Explorer

Every course and every exercise for $1 a month.

Explorer also includes the Model Builder, all 174 templates and SQL for every warehouse. Cancel anytime.

Questions

What do I need to take the courses?

An offdataai Explorer plan, which is $1 a month. It includes every course and every hands-on exercise, plus the Model Builder, the 174 templates and SQL for every warehouse.

How are the exercises checked?

Each exercise has a set of rules, such as the fact table's grain, the keys a Type 2 dimension needs, or whether a metric counts distinct orders. The checklist updates live as you build, and each rule you haven't met yet has a hint one click away. Checks are deterministic, so the same model always gets the same result.

Do I need to know SQL?

Basic SQL helps, but the exercises are about design decisions, not syntax. Beginner tracks start from what a row in a table means.

Who writes the lessons?

Data architects who design warehouses for a living. Every lesson is tied to a real pattern you can also open at full size in the template gallery.

In what order do I learn?

One guided path: Foundations first (the vocabulary and best practices of every approach), then relational modeling, dimensional modeling, Data Vault 2.0, a semantic layer, an ontology, the context layer for AI agents, and finally a capstone project. Lessons unlock one at a time as you pass them, and each module opens when the previous one is complete.

Do I get a certificate?

Yes. Every module earns its own certificate, and completing the whole path earns a programme certificate. Each one has a public verification page with a credential ID, and you can add it to your LinkedIn profile or share it as a post in one click. The name on it is the name on your account.

What is the capstone project?

You take one fictional business, Brewly, from its brief to an AI-ready data product: business concepts, the source model, a star schema with history, a subscription snapshot, governed metrics, an ontology and PII guardrails. Each step continues your own work from the step before, and the last one answers the team's real questions with what you built.

Is AI used to grade my work?

No. Every exercise is checked against fixed design rules, so the same work always gets the same result and nothing you do in Learn uses AI credits.

Can I cancel?

Yes, anytime, from the billing page in the app. Your progress stays on your account.

Start reading for free

How to Learn Data Modeling: A Roadmap From Beginner to Data Architect

A structured learning path for data modeling, from relational basics and SQL to Kimball, Data Vault, semantic layers and ontologies, with what to practise at each stage and how to know you are ready to move on.

8 min read

What Is Grain in Data Modeling? How to Declare It and Avoid Common Mistakes

Grain is the definition of what one row in a fact table represents. How to declare it, worked examples from e-commerce, SaaS, banking and healthcare, and the mistakes that break reports.

8 min read

Data Modeling Best Practices: Naming, Keys, Nullability, PII and Documentation

A practical checklist of data modeling best practices for warehouses and operational databases: naming conventions, keys, data types, nullability, PII handling, testing and documentation.

8 min read

Data Vault vs Kimball: When to Pick Which, and How Hybrid Architectures Work

Data Vault 2.0 and Kimball dimensional modeling solve different problems. A practical comparison of structure, change handling, auditability and effort, and how to combine them.

7 min read

How to Define Metrics in a Semantic Layer: Simple, Ratio and Derived Metrics

A practical guide to metric definitions in a semantic layer. Measures vs metrics, simple, ratio and derived metrics, additivity, allowed dimensions, time grains, and a complete YAML example.

8 min read

How to Build an Ontology for Your Data: Concepts, Definitions and Relationships

A step-by-step guide to building a business ontology for a data platform. Choosing concepts, writing definitions, naming relationships as verb phrases, and mapping them to tables and columns.

8 min read